
Page 15 - Issue 01
P. 15
3. Supply constraints: India's financial system has faced difficulties since 2012. This has manifested itself as
business failure at ILFS and other financial firms, large and small. Credit growth was decelerating prior to
the lockdown. The difficulties for the financial sector increased when the Reserve Bank of India announced
a moratorium on all loan repayments for three months from March to May 2020, and then extended it for
another three months. These moratoriums made it more difficult for financial firms to assess the credit
quality of borrowers. Overall bank credit growth was 5.8% in September 2020 compared to 8.1% in
September 2019. From 2018 onwards, when certain borrowers faced supply constraints, they would have
had to deleverage (repaying old loans while not getting new ones) or default. The grand question of the field
consists of understanding the economic condition of households in India in 2020, in examining how
consumption was held up through new kinds of labour supply and through borrowing, and in obtaining
insights into these three distinct economic forces that are in play. In this article, we discover some new
facts that contribute towards this overall research agenda.
Methodology
We source data from the Consumer Pyramids Household Survey (CPHS) for the months of May, June, July
and August from the years 2016 - 2020. The borrowing data comes from the Aspirational India table within
CPHS. Using this we ask three questions: 1. Did households have debt outstanding at the time of the survey?
This helps us understand the total number of borrowers in the economy. 2. What are the sources from
whom households have outstanding borrowings? This tells us whether households borrow from the formal
or the informal sector. 3. What is the purpose for which households have outstanding
borrowings? This tells us if households are
borrowing for consumption expenditure, for
consumer durables, or for running their
businesses. CPHS does not provide
information on the value of debt outstanding.
We are, therefore, not able to analyse the
impact on borrowing on an intensive margin.
Our analysis is restricted to understanding the
proportion of households borrowing from
various sources, for various reasons, i.e. on the
extensive margin. Household weights for each
wave are provided by CPHS -- these are used
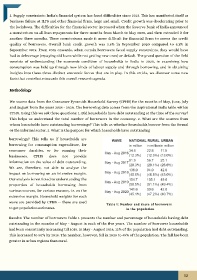
Table 1: Number and share of borrowers
to get population estimates. in the population
Results: The number of borrowers Table 1 presents the number and percentage of households having debt
outstanding in the months of May - August in each of the five years. The number of borrower households
had been consistently increasing till 2019. In May - August 2016, 12% of the population had debt outstanding.
This increased to 50% by 2019. The number, however, fell in 2020 to 45% of the population. The fall has been
greater in urban regions than rural.
12